COVID-19 Expenditure Analysis
As part of a senior research project, we are exploring the following question in this COVID-19 Spending Analysis.
Did the COVID-19 pandemic cause a significant change in the amount of infrastructure spending in the United States?
Why? Real world analysis can consist of analyzing how government spending is affected by large natural disasters and analyzing yearly trends within government spending. This can help government officials as well as economists prepare or make decisions in the wake of natural disasters to better mitigate its effects. We plan to use causal inference because we can easily use a matching technique to see how each infrastructure type was affected each month by the COVID-19 pandemic.
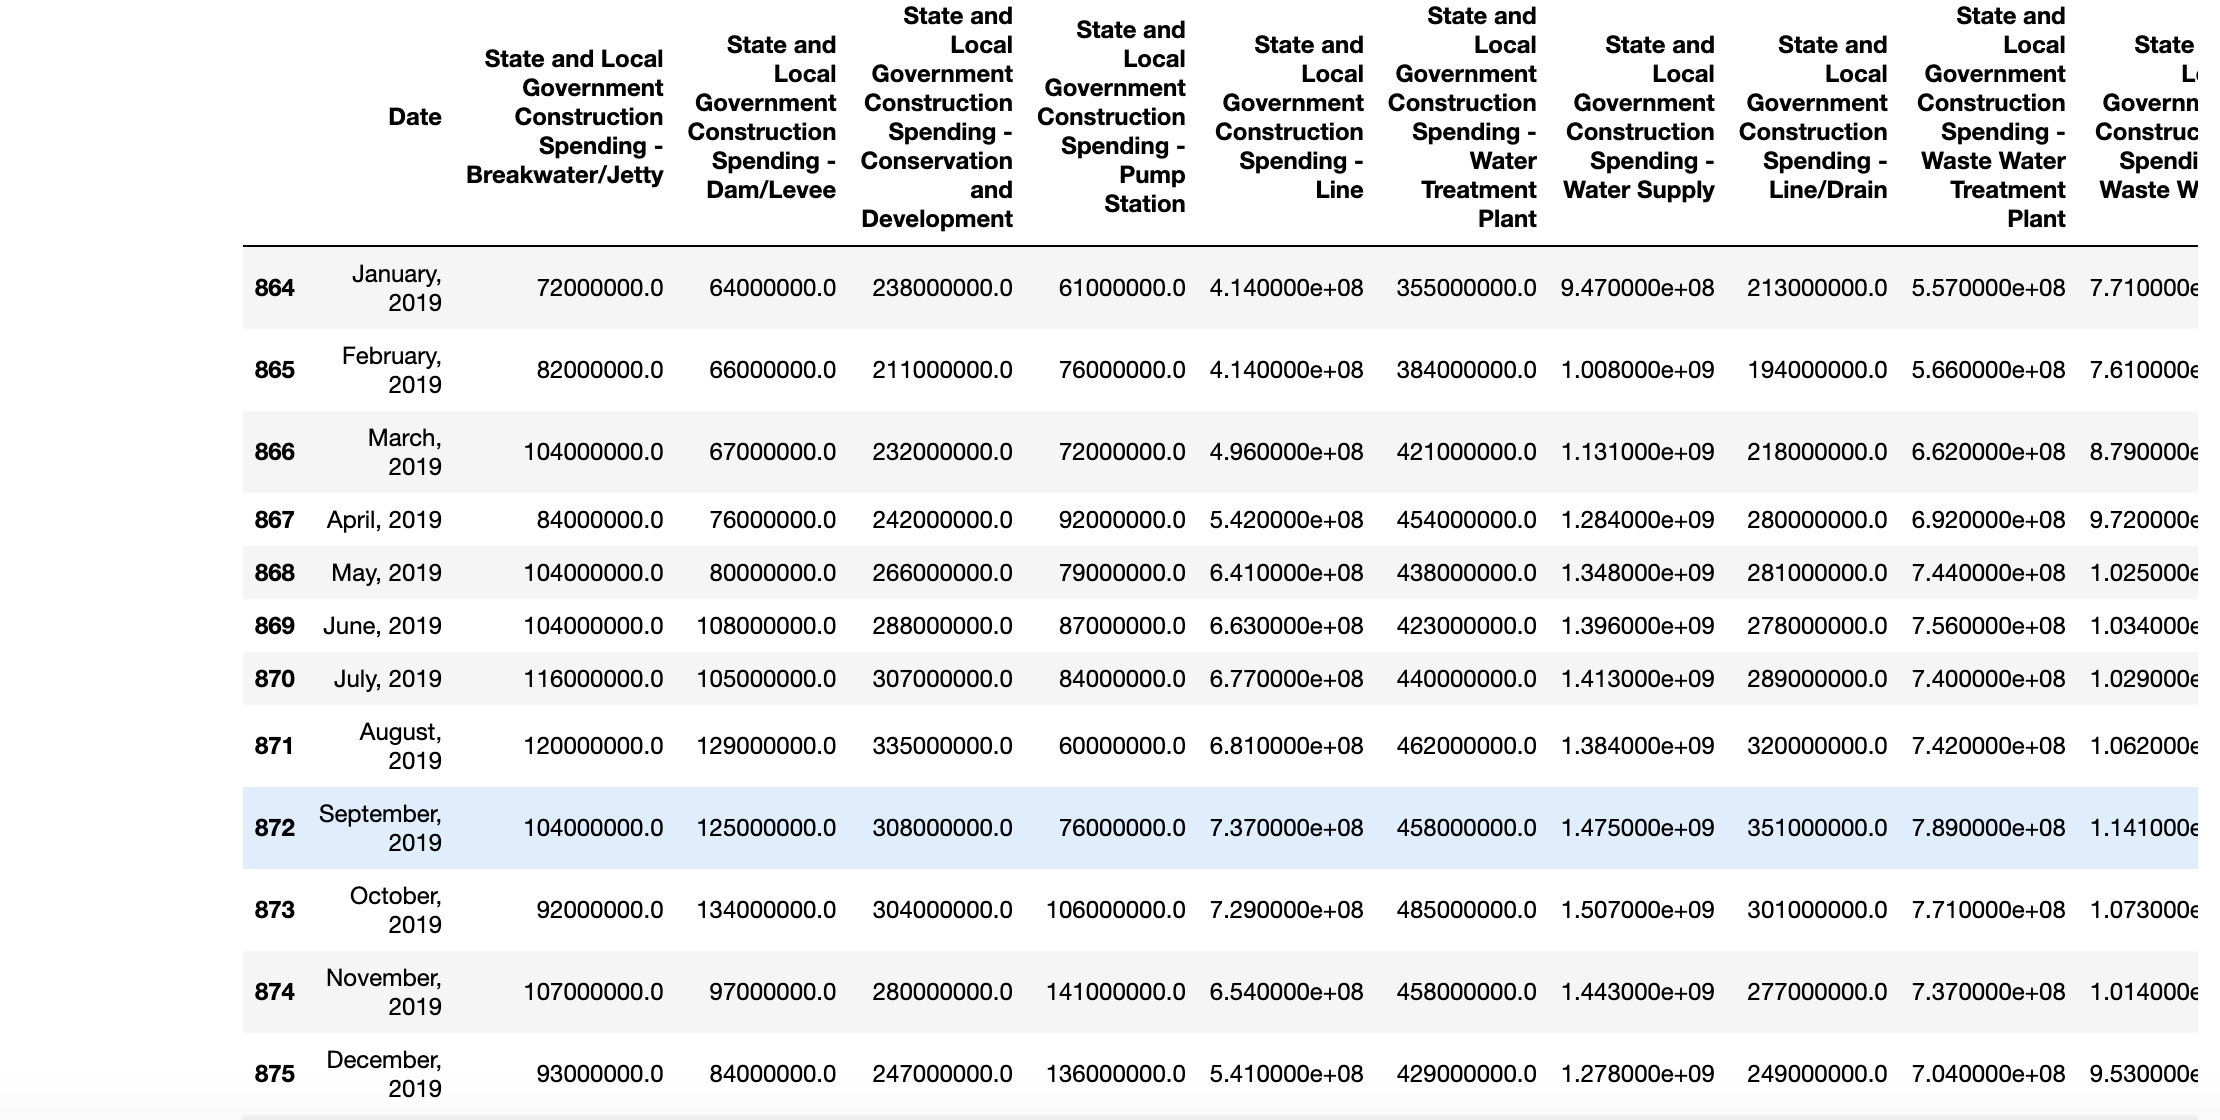
Taking a dataset from the Bureau of Transportation Statistics that reports all airline traffic, transit ridership, transportation, employment, infrastructure spending, and transboundary movement between 1947 and 2022, we can clean and extract the infrastructure spending data from 2019 to 2022 to perform an analysis.
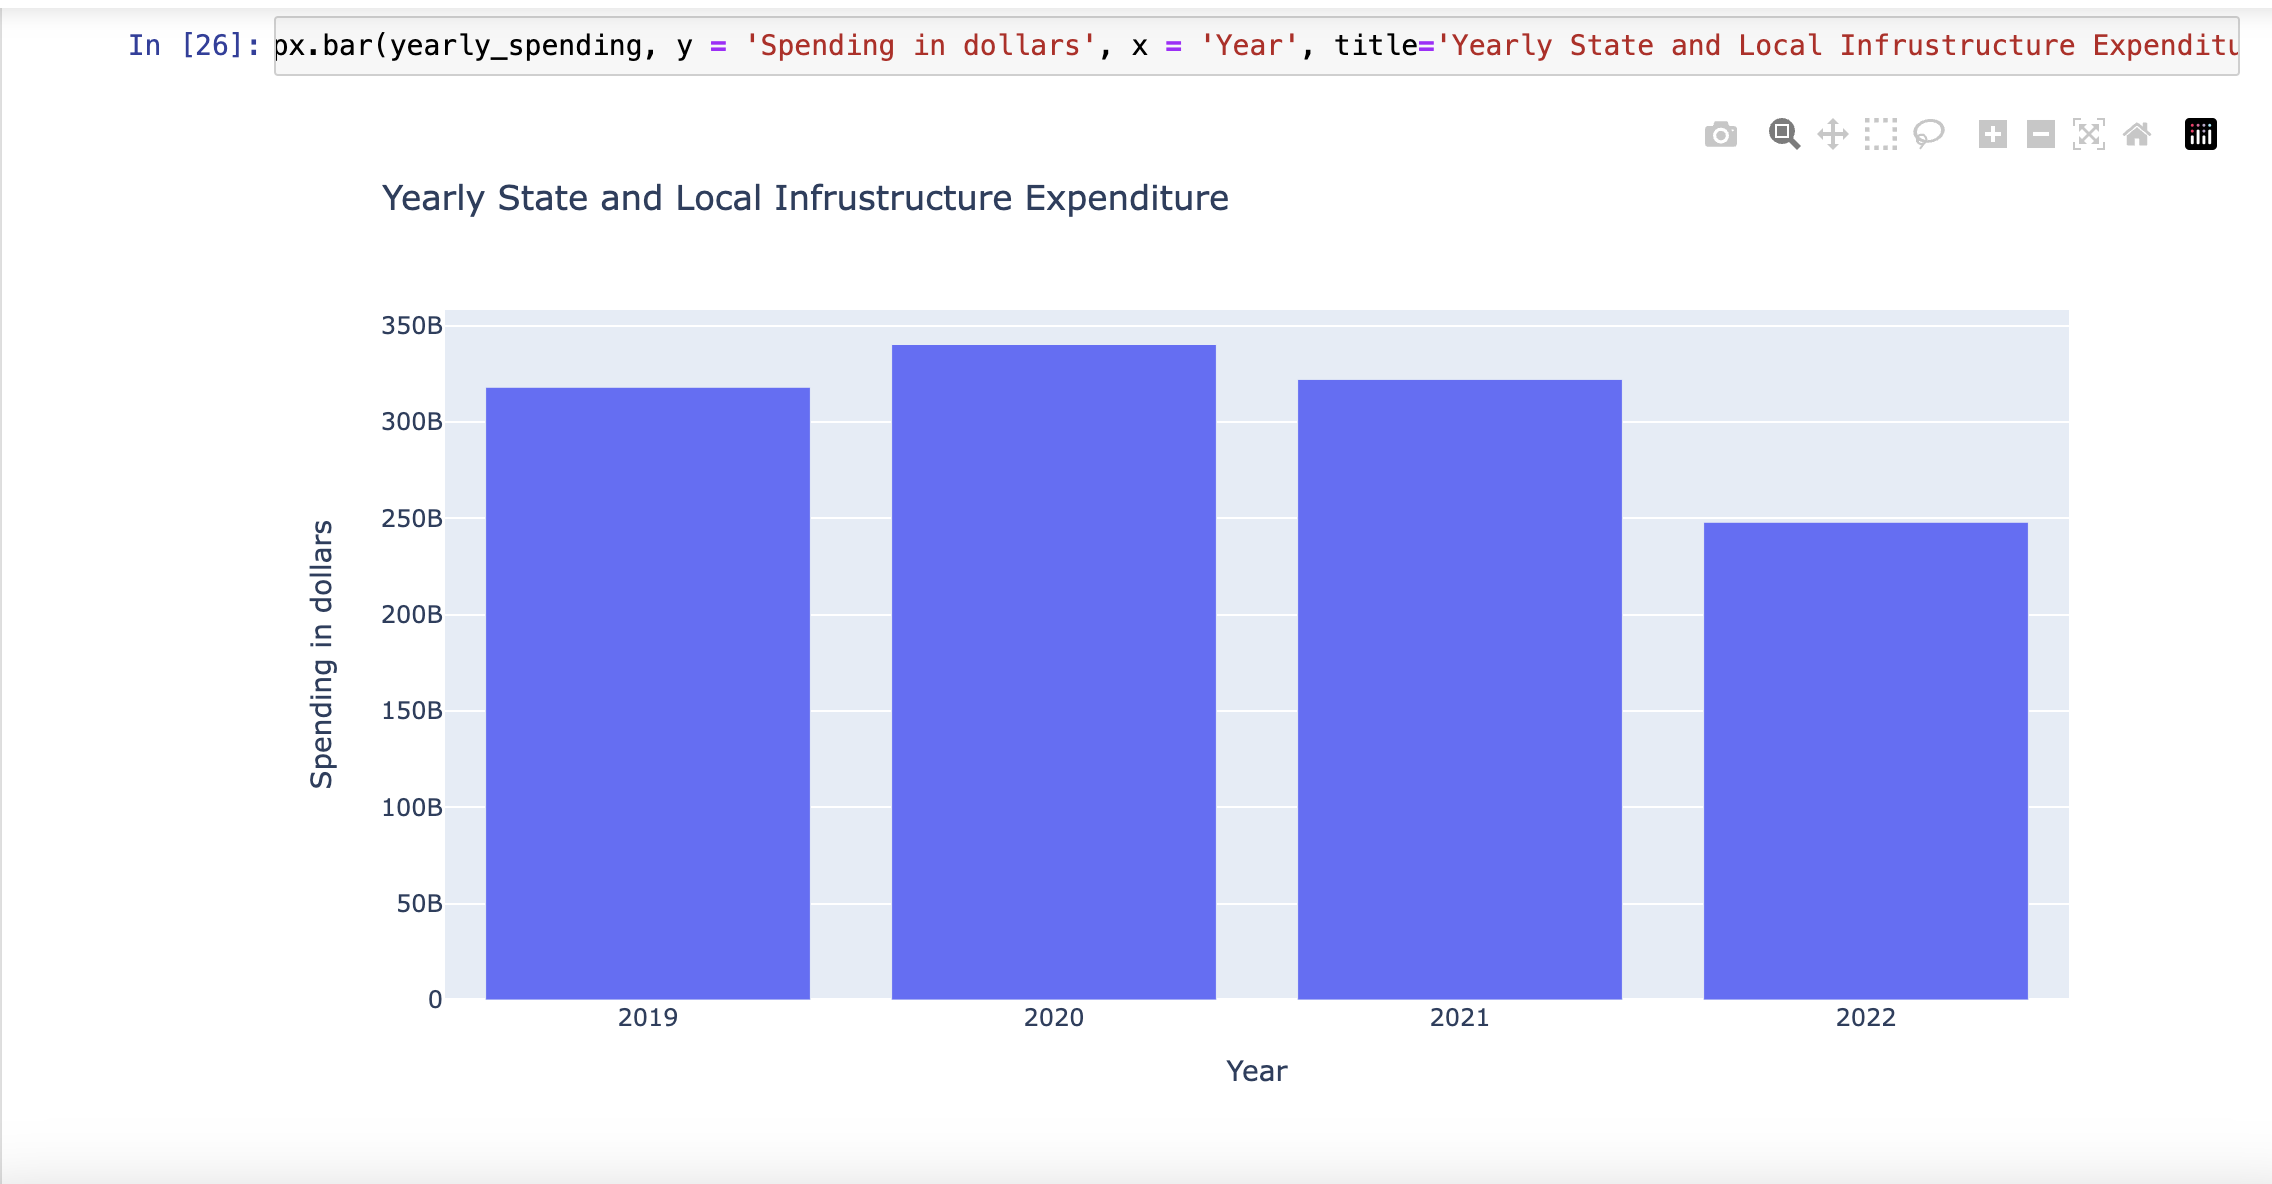
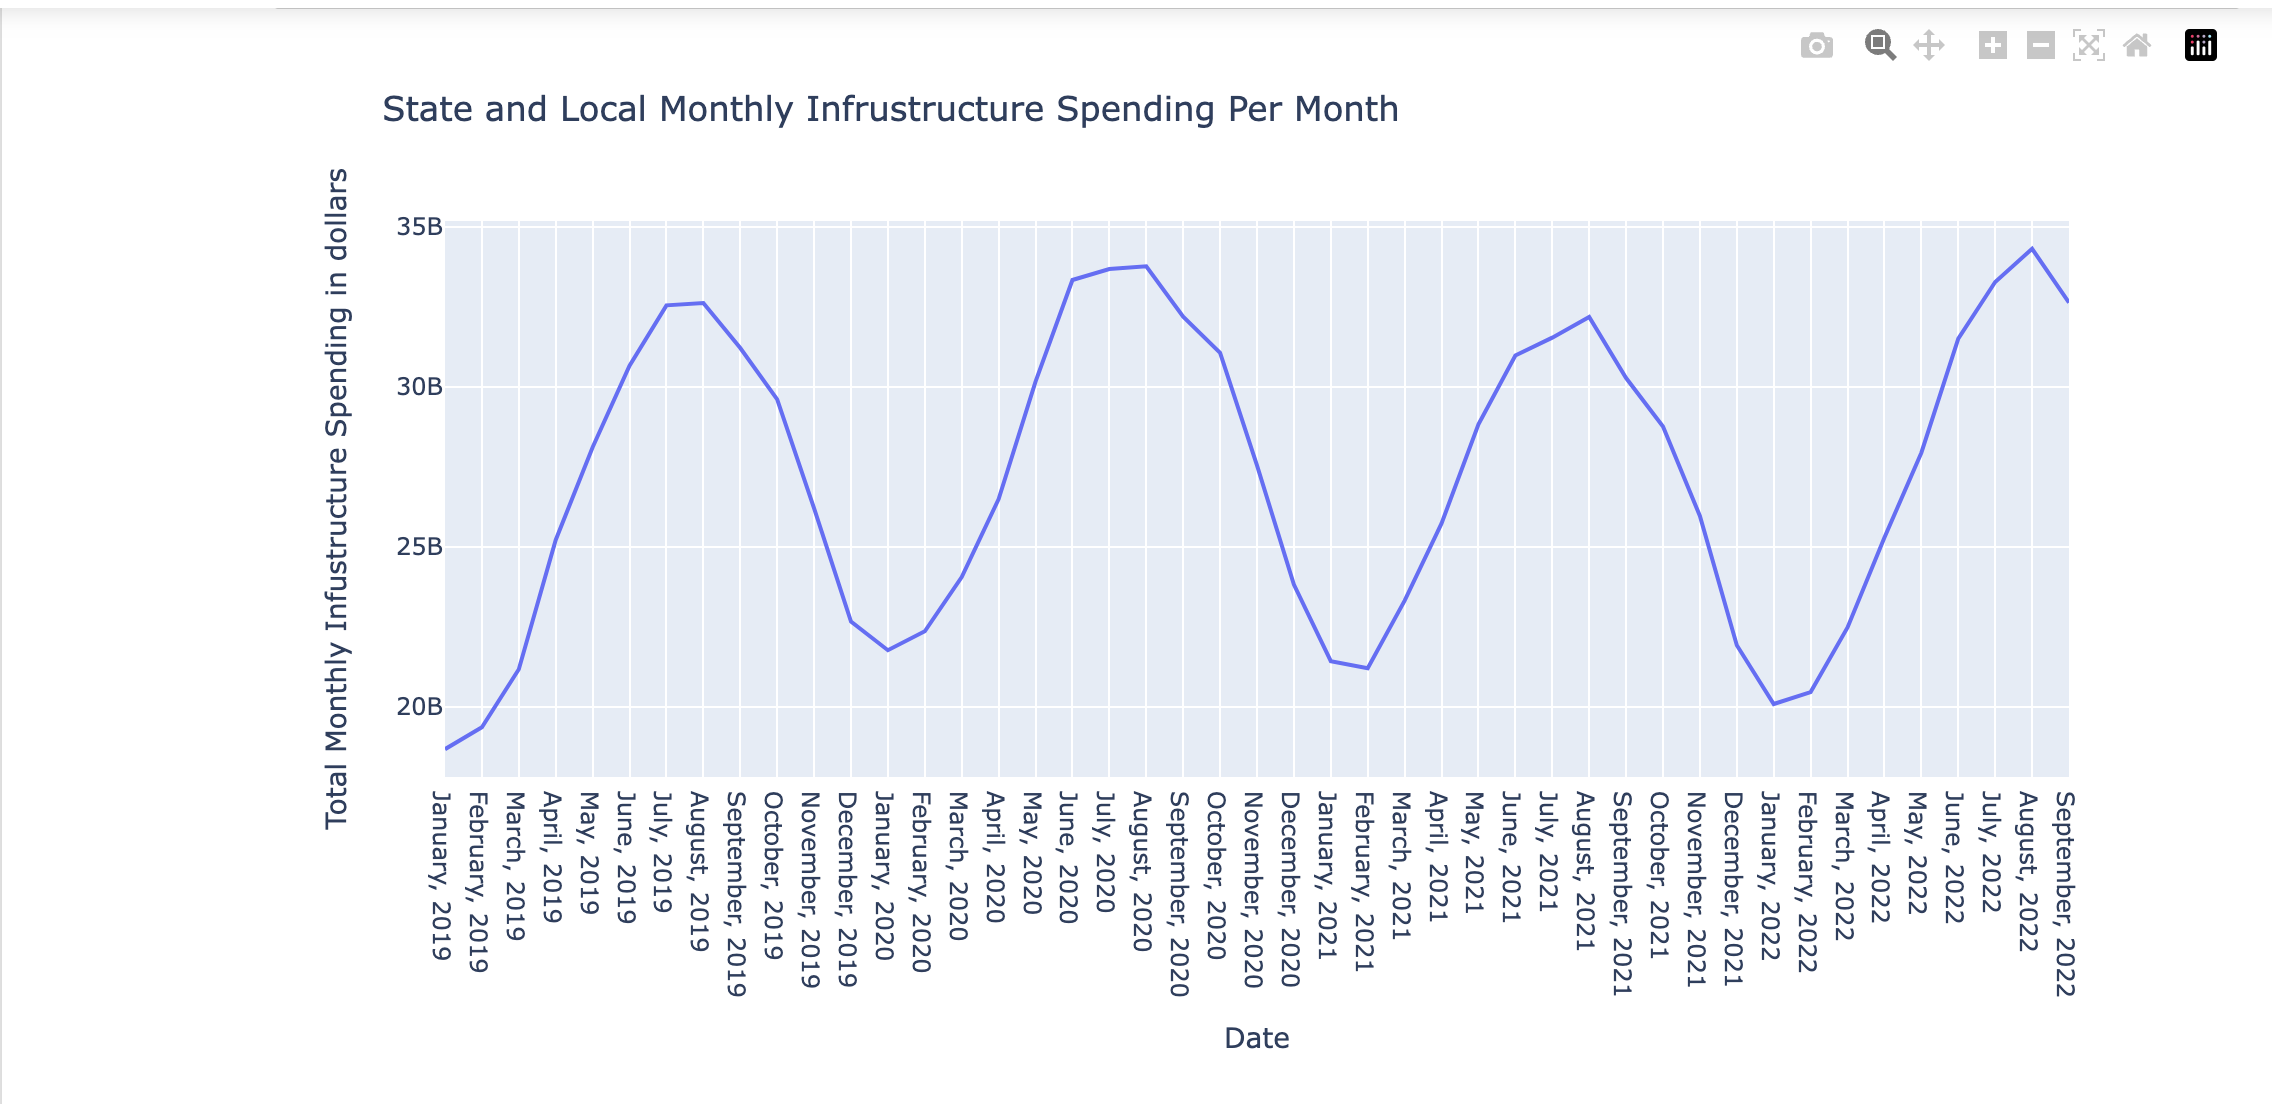
Looking at the data, we see that 2022 actually has a significant lower yearly expenditure than 2020, mainly because, at the time of this study, 2022 was not over yet, so the full year’s expenditure couldn’t be taken into consideration. Even looking at monthly spending, however, indicates that 2022 had a lower spending relative to 2020 up until September.
Now, to answer the question of causality, we can use a matching technique between pre and post-pandemic spending, where the metric would be dollars of spending, the units would be the monthly expenditure per infrastructure type, and confounders would be the state of the economy (unemployment, interest rates, etc), the political control of the government (Republican vs.Democrat), trends in spending per time of year. We mainly need to test 2019 to 2020 to see the effects of the pandemic on spenditure.
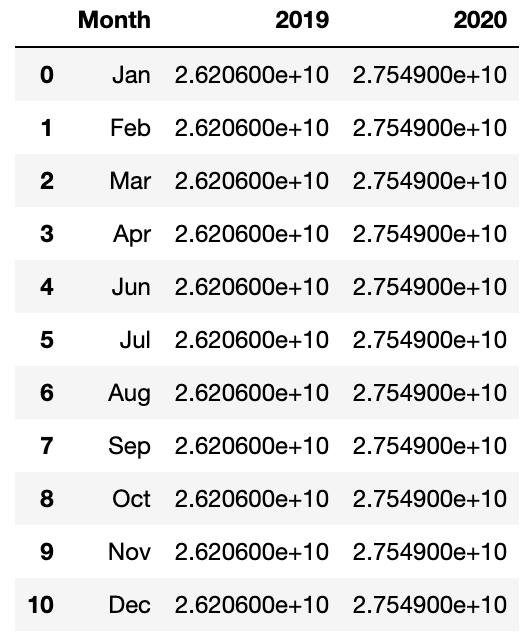
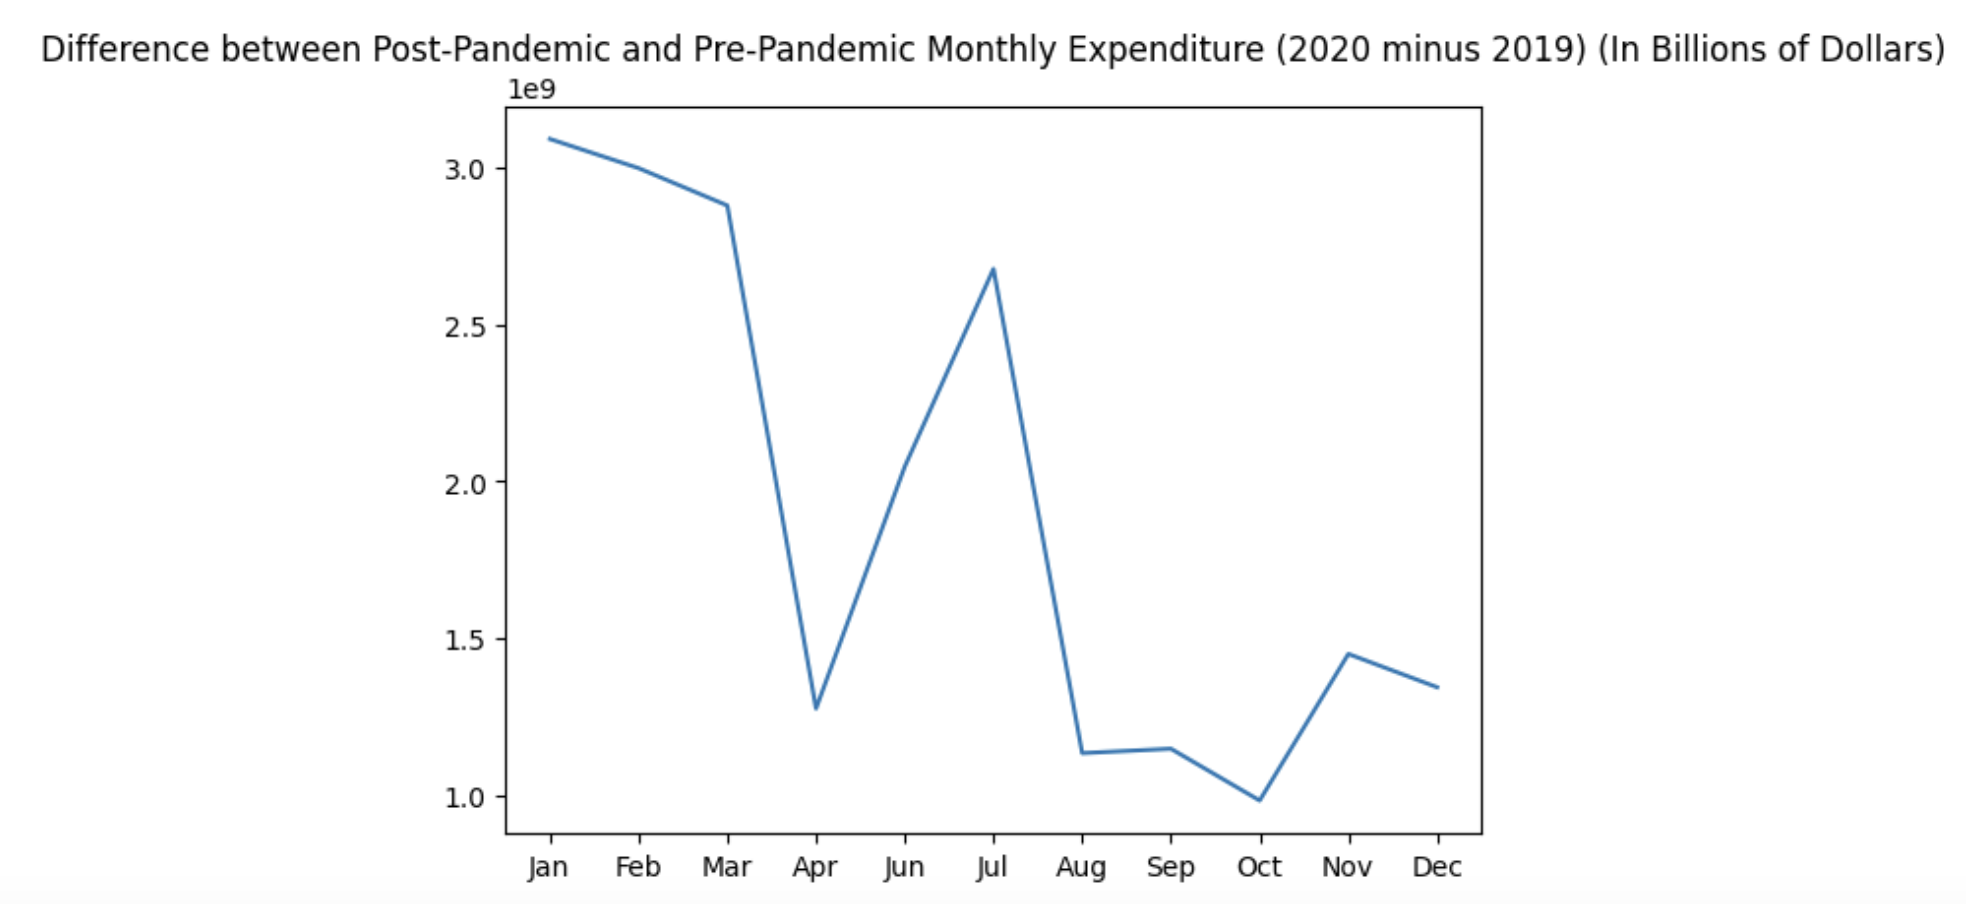
Using the matching method to match total spending during months within the COVID-19 pandemic and months prior to the COVID-19 pandemic, we see that every month during the COVID-19 pandemic has more total government infrastructure spending than its corresponding month prior to the pandemic. We also calculated that the average treatment effect (ATE: difference between outcome and control group) is $1,847,750,000.
After analyzing the data, there does seem to be a causal relationship between the COVID-19 pandemic and the amount of government infrastructure spending within the United States. Additionally, in looking not only at the total spending, but in specific sectors of infrastructure such as with Dams and Levees, we also notice a similar pattern where each month in 2020 has an increase in spending compared to its 2019 counterpart. However, even by using the matching technique to account for confounding factors, these factors can still have an influence on the data we see. Moreover, our findings are not very broad since we mainly compared spending in 2019 to 2020 on a monthly basis, along with 2020 to 2022. In looking to the future, while our findings only looked at a small period of time from 2019 to 2020, it would be interesting for future projects to look at the long lasting effects that the COVID-19 pandemic has had on government spending.